Graphviz介绍
像写代码一样画图。
Graphviz是一个从dot语言生成图片的工具,下面是一个dot示例和它对应的图片:
| 代码块 |
|---|
digraph G {
    a -> b;
    a -> c;
    a -> d;
} |
| Graphviz |
|---|
|
digraph G {
    a -> b;
    a -> c;
    a -> d;
} |
相关链接:
Graphviz官网:https://graphviz.org/
dot语言官方文档:https://graphviz.org/doc/info/lang.html
dota语言维基百科:https://zh.wikipedia.org/wiki/DOT语言
测试工具:
在vscode上安装Graphviz (dot) language support for Visual Studio Code这个插件,创建dot文件,按Ctrl+Shift+P后输入Graphviz,选择Graphviz: Open Preview to the Side即可实时预览dot图片。
几个图形示例
示例来源:https://zh.wikipedia.org/wiki/DOT语言, https://graphviztutorial.readthedocs.io/zh_CN/latest/index.html
无向图
| 代码块 |
|---|
graph {
    a -- b -- c;
    b -- d;
} |
| Graphviz |
|---|
|
graph {
    a -- b -- c;
    b -- d;
} |
有向图
| 代码块 |
|---|
digraph G {
    a -> b -> c;
    b -> d;
} |
| Graphviz |
|---|
|
digraph G {
    a -> b -> c;
    b -> d;
} |
节点属性和边属性
| 代码块 |
|---|
digraph G {
    // label属性可以改变节点显示的名称
    a [label = "Foo"];
    // shape属性可以改变节点的形状
    b [shape = box];
    // color指定连接线的颜色
    a -> b -> c [color = blue];
    // style指定连接线的风格
    b -> d [style = dotted];
} |
| Graphviz |
|---|
|
digraph G {
    // label属性可以改变节点显示的名称
    a [label = "Foo"];
    // shape属性可以改变节点的形状
    b [shape = box];
    // color指定连接线的颜色
    a -> b -> c [color = blue];
    // style指定连接线的风格
    b -> d [style = dotted];
} |
控制边的方向
| 代码块 |
|---|
digraph {
    a -> b [dir = both];
    b -> c [dir = none];
    c -> d [dir = back];
    d -> a [dir = forward];
} |
| Graphviz |
|---|
|
digraph {
    a -> b [dir = both];
    b -> c [dir = none];
    c -> d [dir = back];
    d -> a [dir = forward];
} |
控制边的起点位置和终点位置
| 代码块 |
|---|
digraph {
    // 统一将下面的节点设置成矩形
    node [shape = box];
    // n/e/s/w分别表示north, east, south, west, 可组合使用
    c1:n  -> d1    [label=n];
    c2:ne -> d2:ne [label=ne];
    c3:e  -> d3:ne [label=e];
    c4:se -> d4:n  [label=se];
    c5:s  -> d5:n  [label=s];
    c6:sw -> d6:n  [label=sw];
    c7:w  -> d7:nw [label=w];
    c8:nw -> d8:nw [label=nw];
} |
| Graphviz |
|---|
|
digraph {
    // 统一将下面的节点设置成矩形
    node [shape = box];
    // n/e/s/w分别表示north, east, south, west, 可组合使用
    c1:n  -> d1    [label=n];
    c2:ne -> d2:ne [label=ne];
    c3:e  -> d3:ne [label=e];
    c4:se -> d4:n  [label=se];
    c5:s  -> d5:n  [label=s];
    c6:sw -> d6:n  [label=sw];
    c7:w  -> d7:nw [label=w];
    c8:nw -> d8:nw [label=nw];
} |
Dot语法
整体语法如下:
| 代码块 |
|---|
[strict] (graph | digraph) [ID] {
	stmt_list;
} |
strict关键字表示是否允许重复的边,graph | digraph表示无向图或有向图,ID表示图的名称,stmt_list是图的具体内容。
关于图的具体内容定义如下:
| 代码块 |
|---|
stmt_list : [ stmt [';'] stmt_list ] |
这是一个递归的定义,表示stmt_list由多个stmt组成,每个stmt表示一个语句,后面可用分号结尾。对于stmt,也就是语句的定义如下:list由多个stmt组成,每个stmt表示一个语句,后面可用分号结尾。对于stmt,也就是语句,定义如下:
| 代码块 |
|---|
stmt: node_stmt | edge_stmt | attr_stmt | ID='ID' | subgraph |
这里表示语句可以分成几种类型,包括node_stmt,表示节点类型,edge_stmt,表示边类型,attr_stmt,表示属性类型,ID类型,表示ID重命名,以及subgraph,表示子图。以下表格描述了各种类型的格式:
| 类型 | 形式 | 说明 | 示例 | 示例说明 |
|---|
| node_stmt | ID [attr_list] | 声明一个节点,ID是表示节点名称的字符串,可以带双引号 | a [label = "Foo"]; | a节点使用Foo作为显示文本 |
| attr_list | [k1=v1 k2=v2 ...] | 声明属性列表,key=value形式,多个属性空格隔开 | [style=bold label="hello world"] | 修饰的类型具有加粗属性,显示文本为"helloworld" |
| attr_stmt | (graph | node | edge) attr_list | 定义图,节点,边的全局属性,三选一,该语句之后生效,前面的不影响 | graph [ fontsize=10 fontname="Verdana" ] | 全图字体为Verdana,大小为10 |
| node [shape=box] | 该语句后面的所有节点形状为矩形 |
| edge [style=dotted] | 全图的边都使用虚线 |
| edge_stmt | (node_id | subgraph) edgeRHS [attr_list] | 定义一条边,包括起始位置,连接操作(->或--),结束位置,以及可选的后续位置 | a -> b -> c
a -- b -- c a:ne -> b:n |
|
| edgeRHS | edgeop (node_id | subgraph) [edgeRHS] |
|
| node_id | ID[:n | ne | e | se | s | sw | w | nw | c] | 表示一个位置,最常见的是用节点名称来表示,也可以后面跟上:表示方向 |
|
| subgraph | [ subgraph [ID] ] { stmt_list } | 表示一个子图 | subgraph sub_0 { a->b } { rank=same; a b c } |
|
属性
参考官方文档:https://graphviz.org/doc/info/attrs.html
支持对图的各项元素设置属性,比如修改节点形状,边的类型,图的字体和大小等。属性有具体的作用对象,并且属性并不是通用的,也就是一类属性只能修饰一类元素。属性具有属性名和属性值,两者都是区分大小写的。具体的属性列表可以参考上面的官方文档,下面列表一些常用的属性,作用对象中的E, N, G, S, C分别表示edge, node, the root graph, subgraph, cluster subgraph。
| 名称 | 作用对象 | 类型 | 默认值 | 说明 | 示例 |
|---|
| label | ENGC | string |
| 标签文本 | a -> b [label="Foo"] |
| shape | N | string |
| 指定节点形状 | a [shape="box"] |
| dir | E | 字符串枚举,forward/back/both/none |
| 指定箭头方向 | a -> b [dir="both"] |
| style | ENGC |
|
| 指定显示风格 | a [style="filled"] |
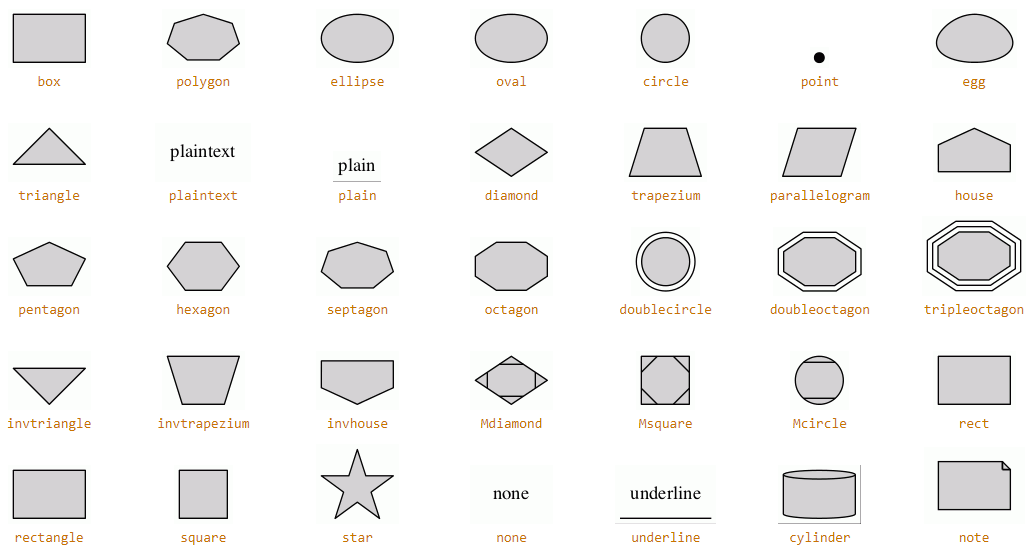
节点形状
参考官方文档:https://graphviz.org/doc/info/shapes.html
节点形状可分为三大类型:基于多边形(polygon-base),基于记录值(record-based),以及用户自定义的(user-defined)。基于记录值的形状定义已经正在由HTML替代,而用户自定义则和PostScript有关,比较复杂。
基于多边形
基于多边形是指用图形来描述形状,比如 shape=box,以下是常见的图形效果,几个特殊值描述如下:
box/rec/rectangle等效,都表示矩形
none/plaintext等效,表示无边框
基于记录值
shape=record或shape=Mrecord,用节点的值来描述节点的形状,而不是用属性来指定,以下是一个示例:
| 代码块 |
|---|
digraph structs {
    node [shape=record];
    struct1 [label="<f0> left|<f1> mid\ dle|<f2> right"];
    struct2 [label="<f0> one|<f1> two"];
    struct3 [label="hello\nworld |{ b |{c|<here> d|e}| f}| g | h"]; // 宏bug,\n无法被渲染成换行
    struct1:f1 -> struct2:f0;
    struct1:f2 -> struct3:here;
} |
效果如下:
| Graphviz |
|---|
| UUID | graphviz_container_record_based |
|---|
|
digraph structs {
    node [shape=record];
    struct1 [label="<f0> left|<f1> mid\ dle|<f2> right"];
    struct2 [label="<f0> one|<f1> two"];
    struct3 [label="hello\nworld |{ b |{c|<here> d|e}| f}| g | h"];
    struct1:f1 -> struct2:f0;
    struct1:f2 -> struct3:here;
} |
通过示例可以很好地理解record-based的形状如何指定。值得注意的是,这种方式需要处理好转义字符,括号,大于小于号,竖线,空格都需要使用反斜杠进行转义。如果设置rankdir=LR属性,则会以下面的方式呈现:
| Graphviz |
|---|
| UUID | graphviz_container_record_based_rankdir_LR |
|---|
|
digraph structs {
    rankdir=LR;
    node [shape=record];
    struct1 [label="<f0> left|<f1> mid\ dle|<f2> right"];
    struct2 [label="<f0> one|<f1> two"];
    struct3 [label="hello\nworld |{ b |{c|<here> d|e}| f}| g | h"];
    struct1:f1 -> struct2:f0;
    struct1:f2 -> struct3:here;
} |
如果将struct1改成shape=Mrecord,则会变成下面这样:
| Graphviz |
|---|
| UUID | graphviz_container_mrecord |
|---|
|
digraph {
    node [shape=Mrecord];
    struct1 [label="<f0> left|<f1> mid\ dle|<f2> right"];
} |
另外record-based的形状还可以通过HTML来指定,这点参考官方文档,学不下去了。
箭头形状
参考官方文档:https://graphviz.org/doc/info/arrows.html
和箭头相关的属性包括arrowhead, arrowsize, arrowtail三项,这三项属性都是对边(edge)生效,如果要修改全局的箭头形状,只需要在图开头指定 edge的属性即可。按官方文档的描述,除了可以设置箭头形状,还可以设置箭头是否空心,是否只保留左半边或右半边,是否同时应用多个箭头形状等属性。另外,arrowtail只有在dir属性为back或both才生效。以下是一个示例:
| 代码块 |
|---|
digraph {
    a0 -> b0                            // 默认是normal类型
    a1 -> b1 [arrowhead=none]           // 无箭头
    a2 -> b2 [arrowhead=diamond]        // 更新箭头为diamond
    a3 -> b3 [dir=both arrowtail=diamond arrowhead=diamond] // 箭头和箭尾为diamond,只有dir为back或both才生效
    a4 -> b4 [arrowhead=lteeoldiamond ] // 参考官方文档,空心,左半边,tee | diamond
} |
| Graphviz |
|---|
| UUID | graphviz_container_arrow |
|---|
|
digraph {
    a0 -> b0                            // 默认是normal类型
    a1 -> b1 [arrowhead=none]           // 无箭头
    a2 -> b2 [arrowhead=diamond]        // 更新箭头为diamond
    a3 -> b3 [dir=both arrowtail=diamond arrowhead=diamond] // 箭头和箭尾为diamond,只有dir为back或both才生效
    a4 -> b4 [arrowhead=lteeoldiamond ] // 参考官方文档,空心,左半边,tee | diamond
} |
一些其他的示例
子图1
上面的语句等效于:
子图2
| 代码块 |
|---|
subgraph {
    rank=same; A; B; C;
} |
这个子图含有3个节点,并且这3个节点会并排显示。
以cluster开头命名的子图
以cluster开头命名的子图会被渲染引擎进行特殊渲染,包括将节点画在一起,并且用一个矩形框包括起来,支持设置矩形框的颜色和文文本,以下是一个示例:
| 代码块 |
|---|
digraph {
    node [shape=record];

    subgraph cluster_0 {
        node [style=filled];
        label = "cluster 0";
        color = blue;
        a -> b;
    }

    subgraph cluster_1 {
        node [style=filled];
        label = "cluster 1";
        color = blue;
        c -> d;
    }
} |
| Graphviz |
|---|
|
digraph {
    node [shape=record];

    subgraph cluster_0 {
        node [style=filled];
        label = "cluster 0";
        color = blue;
        a -> b;
    }

    subgraph cluster_1 {
        node [style=filled];
        label = "cluster 1";
        color = blue;
        c -> d;
    }
} |
中心对齐结点和边
来源:https://stackoverflow.com/questions/27504703/in-graphviz-how-do-i-align-an-edge-to-the-top-center-of-a-node
| 代码块 |
|---|
graph {
    splines=ortho;
    {0, 1, 2, 3 [width=0, shape=point, style=invis];}
    {rank=same; 1 -- 2 -- 3;}
    0 -- 2;
    node [shape=box];
    {rank=same; A -- 0 -- B;}
    1 -- C;
    1 -- D;
    3 -- E;
    3 -- F;
} |
| Graphviz |
|---|
| UUID | graphviz_container_aligh_edge_to_the_top_center_of_node |
|---|
|
graph {
    splines=ortho;
    {0, 1, 2, 3 [width=0, shape=point, style=invis];}
    {rank=same; 1 -- 2 -- 3;}
    0 -- 2;
    node [shape=box];
    {rank=same; A -- 0 -- B;}
    1 -- C;
    1 -- D;
    3 -- E;
    3 -- F;
} |
双链表和树
来源:https://stackoverflow.com/questions/13898151/drawing-outgoing-edges-starting-from-the-center-of-record-elements-in-graphviz
| 代码块 |
|---|
digraph G {
    node [shape = record];
    edge[headclip=false, tailclip=false];

    node0 [ label ="<f0> | <f1> J | <f2> "];
    node1 [ label ="<f0> | <f1> E | <f2> "];
    node4 [ label ="<f0> | <f1> C | <f2> "];
    node6 [ label ="<f0> | <f1> I | <f2> "];
    node2 [ label ="<f0> | <f1> U | <f2> "];
    node5 [ label ="<f0> | <f1> N | <f2> "];
    node9 [ label ="<f0> | <f1> Y | <f2> "];
    node8 [ label ="<f0> | <f1> W | <f2> "];
    node10 [ label ="<f0> | <f1> Z | <f2> "];
    node7 [ label ="<f0> | <f1> A | <f2> "];
    node3 [ label ="<f0> | <f1> G | <f2> "];

    // identical result: "node0" -> "node1";
    "node0":f1:c -> "node1":f1:c;
    "node0":f1:c -> "node2":f1:c;

    "node1":f1:c -> "node4":f1:c;
    "node1":f1:c -> "node6":f1:c;
    "node4":f1:c -> "node7":f1:c;
    "node4":f1:c -> "node3":f1:c;

    "node2":f1:c -> "node5":f1:c;
    "node2":f1:c -> "node9":f1:c;

    "node9":f1:c -> "node8":f1:c;
    "node9":f1:c -> "node10":f1:c;
} |
| Graphviz |
|---|
| UUID | graphviz_container_double_linklist_tree |
|---|
|
digraph G {
    node [shape = record];
    edge[headclip=false, tailclip=false];

    node0 [ label ="<f0> | <f1> J | <f2> "];
    node1 [ label ="<f0> | <f1> E | <f2> "];
    node4 [ label ="<f0> | <f1> C | <f2> "];
    node6 [ label ="<f0> | <f1> I | <f2> "];
    node2 [ label ="<f0> | <f1> U | <f2> "];
    node5 [ label ="<f0> | <f1> N | <f2> "];
    node9 [ label ="<f0> | <f1> Y | <f2> "];
    node8 [ label ="<f0> | <f1> W | <f2> "];
    node10 [ label ="<f0> | <f1> Z | <f2> "];
    node7 [ label ="<f0> | <f1> A | <f2> "];
    node3 [ label ="<f0> | <f1> G | <f2> "];

    // identical result: "node0" -> "node1";
    "node0":f1:c -> "node1":f1:c;
    "node0":f1:c -> "node2":f1:c;

    "node1":f1:c -> "node4":f1:c;
    "node1":f1:c -> "node6":f1:c;
    "node4":f1:c -> "node7":f1:c;
    "node4":f1:c -> "node3":f1:c;

    "node2":f1:c -> "node5":f1:c;
    "node2":f1:c -> "node9":f1:c;

    "node9":f1:c -> "node8":f1:c;
    "node9":f1:c -> "node10":f1:c;
} |
连接子图
来源:https://stackoverflow.com/questions/2012036/graphviz-how-to-connect-subgraphs
| 代码块 |
|---|
digraph G {

    graph [fontsize=10 fontname="Verdana" compound=true];
    node [shape=record fontsize=10 fontname="Verdana"];

    subgraph cluster_0 {
        node [style=filled];
        "Item 1" "Item 2";
        label = "Container A";
        color=blue;
    }

    subgraph cluster_1 {
        node [style=filled];
        "Item 3" "Item 4";
        label = "Container B";
        color=blue;
    }

    subgraph cluster_2 {
        node [style=filled];
        "Item 5" "Item 6";
        label = "Container C";
        color=blue;
    }

    // Edges between nodes render fine
    "Item 1" -> "Item 2";
    "Item 2" -> "Item 3";

    // Edges that directly connect one cluster to another
    "Item 1" -> "Item 3" [ltail=cluster_0 lhead=cluster_1];
    "Item 1" -> "Item 5" [ltail=cluster_0 lhead=cluster_2];
} |
| Graphviz |
|---|
| UUID | graphviz_container_connect_subgraphs |
|---|
|
digraph G {

    graph [fontsize=10 fontname="Verdana" compound=true];
    node [shape=record fontsize=10 fontname="Verdana"];

    subgraph cluster_0 {
        node [style=filled];
        "Item 1" "Item 2";
        label = "Container A";
        color=blue;
    }

    subgraph cluster_1 {
        node [style=filled];
        "Item 3" "Item 4";
        label = "Container B";
        color=blue;
    }

    subgraph cluster_2 {
        node [style=filled];
        "Item 5" "Item 6";
        label = "Container C";
        color=blue;
    }

    // Edges between nodes render fine
    "Item 1" -> "Item 2";
    "Item 2" -> "Item 3";

    // Edges that directly connect one cluster to another
    "Item 1" -> "Item 3" [ltail=cluster_0 lhead=cluster_1];
    "Item 1" -> "Item 5" [ltail=cluster_0 lhead=cluster_2];
} |
另一个连接子图
来源同上。
| 代码块 |
|---|
digraph G {
  compound=true;
  subgraph cluster0 {
    a -> b;
    a -> c;
    b -> d;
    c -> d;
  }
  subgraph cluster1 {
    e -> g;
    e -> f;
  }
  b -> f [lhead=cluster1];
  d -> e;
  c -> g [ltail=cluster0,lhead=cluster1];
  c -> e [ltail=cluster0];
  d -> h;
} |
| Graphviz |
|---|
| UUID | graphviz_container_connect_subgraphs2 |
|---|
|
digraph G {
  compound=true;
  subgraph cluster0 {
    a -> b;
    a -> c;
    b -> d;
    c -> d;
  }
  subgraph cluster1 {
    e -> g;
    e -> f;
  }
  b -> f [lhead=cluster1];
  d -> e;
  c -> g [ltail=cluster0,lhead=cluster1];
  c -> e [ltail=cluster0];
  d -> h;
} |
其他
. 关键字不区别大小写。
. 有向图用 digraph ,无向图用 graph ,有向图节点之间使用 -> 连接,无向图节点使用 -- 连接。
. 支持注释,支持C风格的注释, /*...*/ 多行注释, // 单行注释,也可以用Shell风格的 # 开头的注释。
. 语句结尾的分号可选。
. 给图加上strict 关键字可消除重复的边,对有向图和无向图都适用。